On a secure cluster, this area of the DB Console can only be accessed by an admin user. See DB Console access.
New in v20.2: The Transactions page helps you:
- Identify frequently retried or high latency transactions.
- View transaction details.
In contrast with the Statements page, which displays SQL statement fingerprints, the Transactions page displays SQL statement fingerprints grouped by transaction.
To view this page, access the DB Console and click Transactions in the left-hand navigation.
Search and filter by application
By default, this page shows transactions from all applications running on the cluster, and hides internal CockroachDB transactions.
To filter the transactions by application_name, use the App pulldown in the Filters menu. If you haven't set application_name in the client connection string, it appears as unset.
- CockroachDB's internal transactions are only displayed under the
$ internalapp. - Transactions from the SQL shell are displayed under the
$ cockroach sqlapp.
You can also search for transactions using the search bar.
Filter by transaction latency
You can filter transactions in which a SQL statement fingerprint exceeds a specified latency value. Use the pulldown in the Filters menu.
Understand the Transactions page
Use this page to identify transactions that you may want to troubleshoot, such as transactions that are experiencing high latencies, multiple retries, or execution failures.
If you haven't yet run any transactions in the cluster as a user, this page will display a blank table.

| Parameter | Description |
|---|---|
| Transactions | Transaction. To view the transaction fingerprint and details, click this to open the Transaction Details page. |
| Statements | Number of SQL statements in the transaction. |
| Retries | Cumulative number of retries of this transaction within the last hour or specified time interval. |
| Execution Count | Cumulative number of executions of this transaction within the last hour or specified time interval. The bar indicates the ratio of runtime success (gray) to retries (red) for the transaction. |
| Rows Affected | Average number of rows returned while executing this transaction within the last hour or specified time interval. The gray bar indicates the mean number of rows returned. The blue bar indicates one standard deviation from the mean. |
| Latency | Average service latency of this transaction within the last hour or specified time interval. This includes the total time the transaction remains open, which can exceed the latency of the SQL statements in the transaction. To view the SQL statement latency for this transaction, see the Transaction Details page. The gray bar indicates the mean latency. The blue bar indicates one standard deviation from the mean. |
Significant transactions on your database are likely to have a high execution count or number of rows affected.
Time interval
By default, the Transactions page displays all transactions executed within a one-hour time interval. The display is cleared at the end of each interval. You can change the interval with the diagnostics.reporting.interval cluster setting.
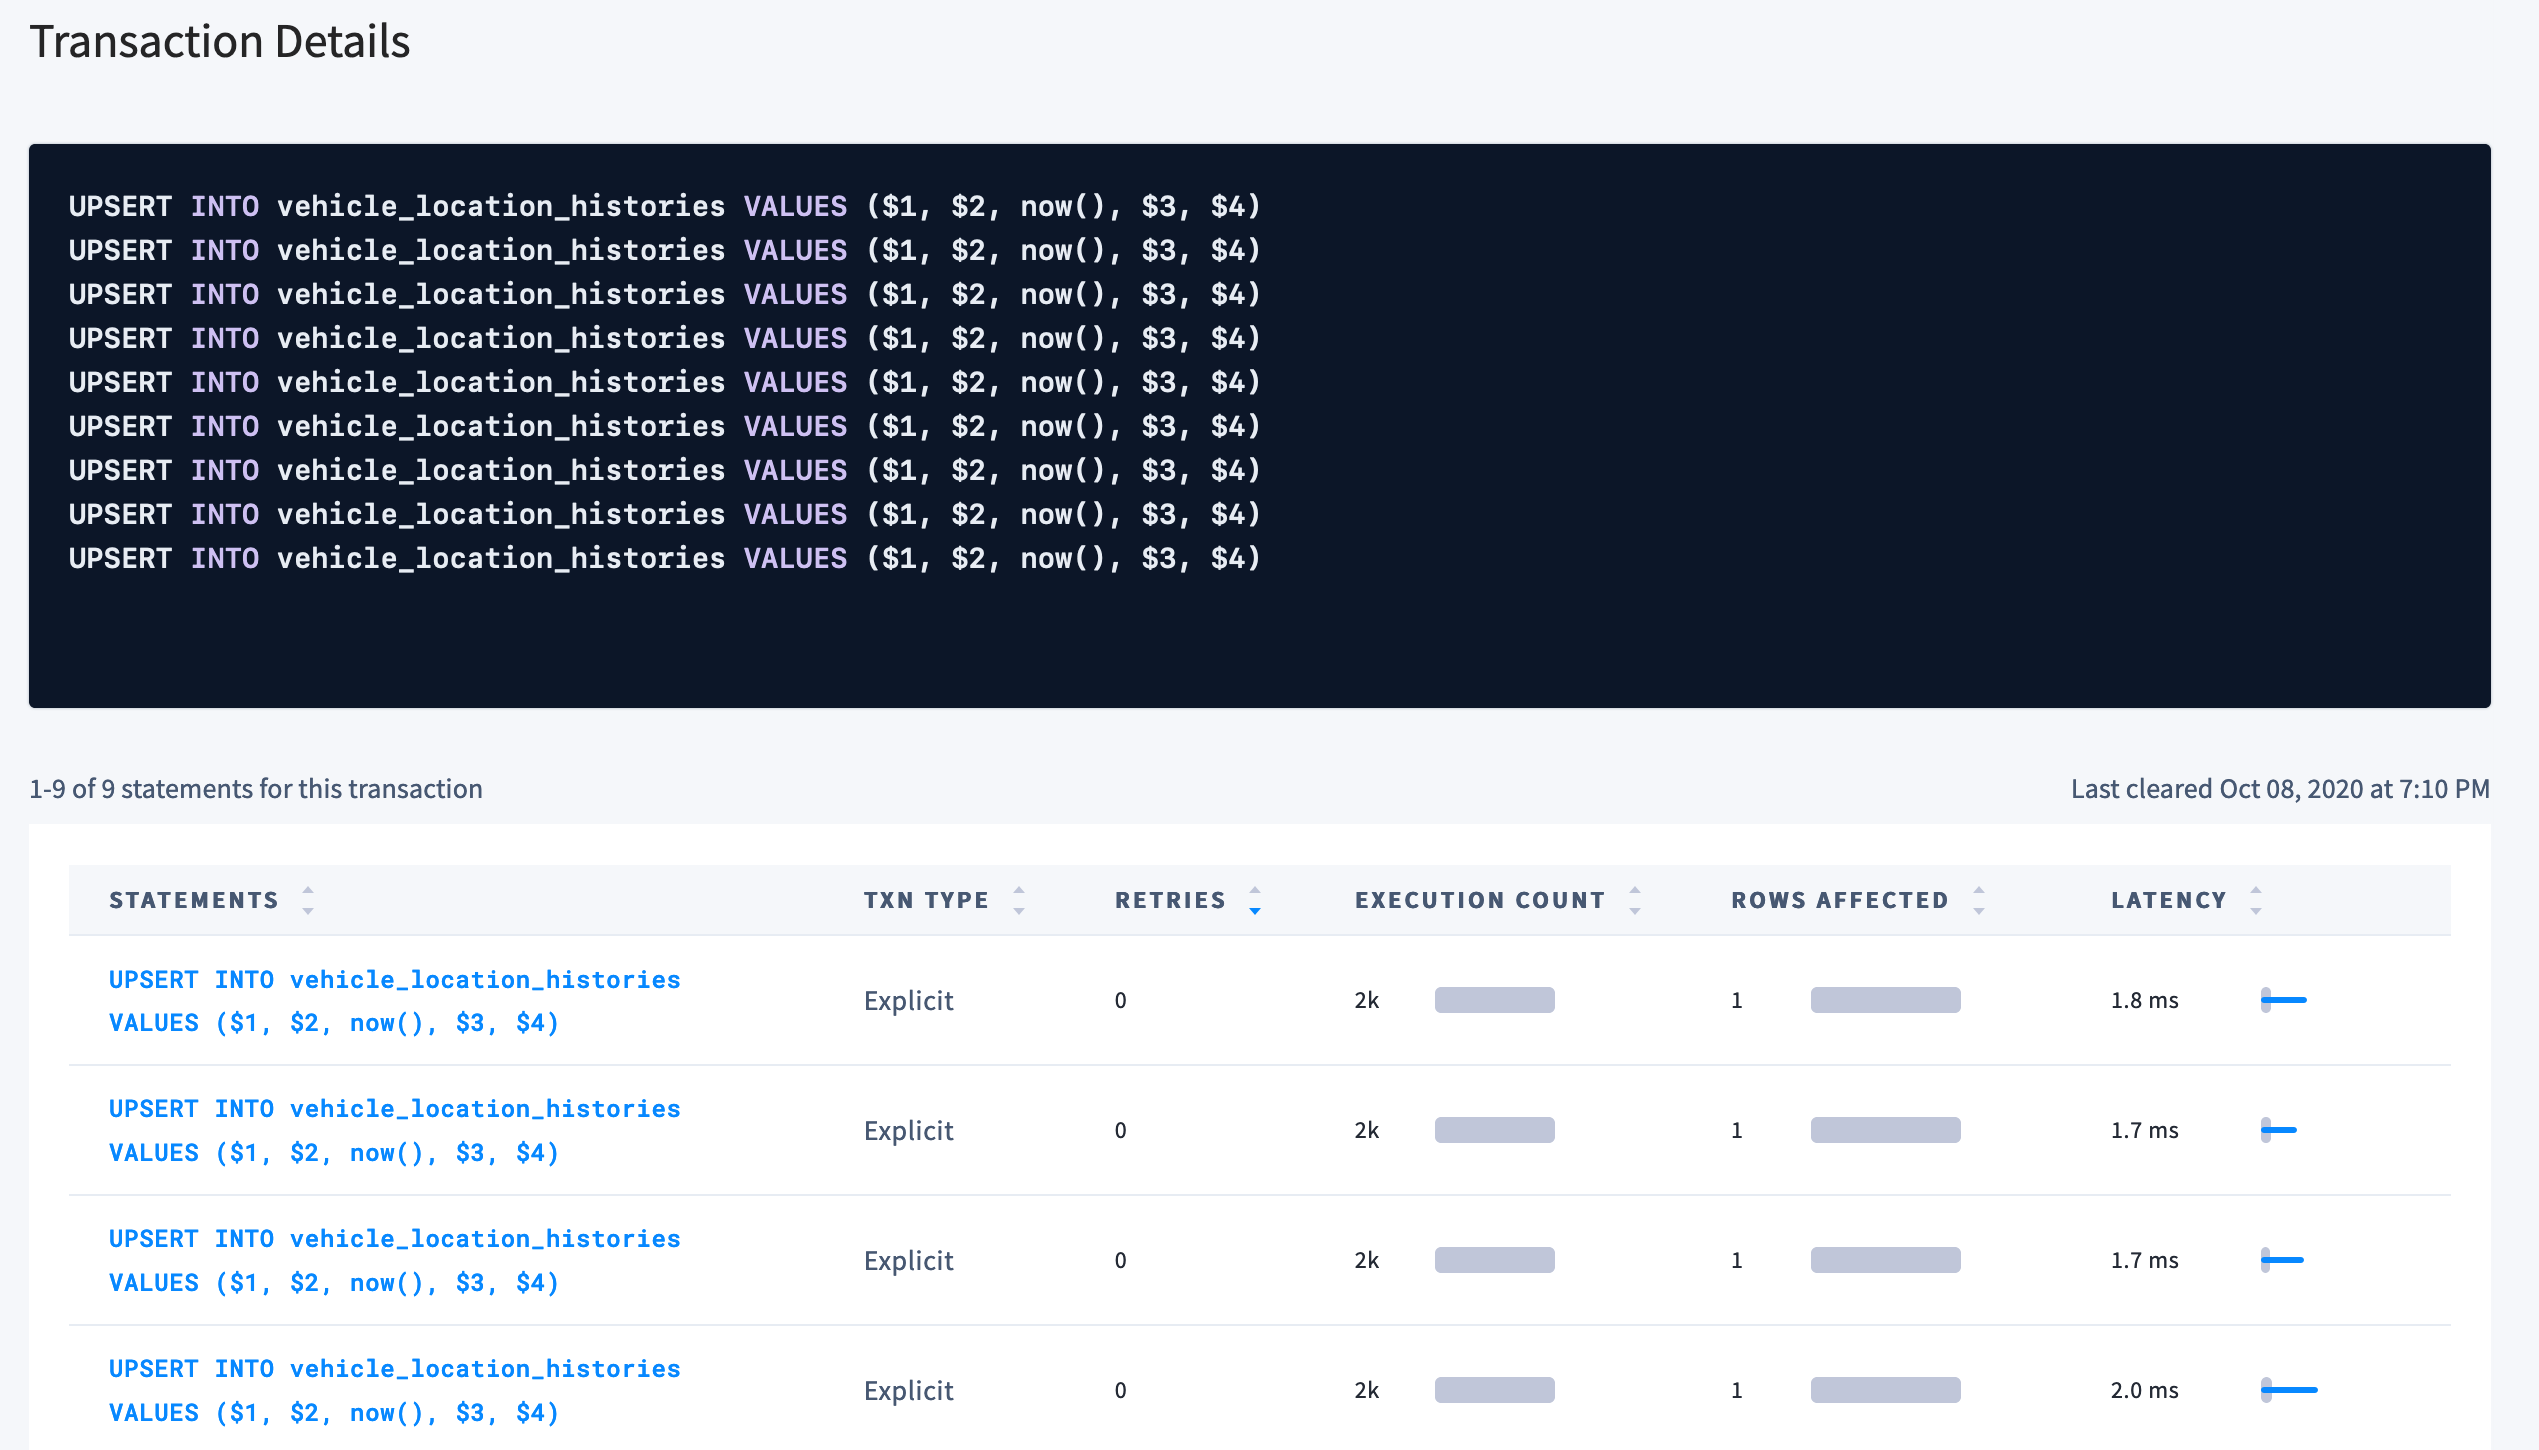
Transaction Details page
Click on a transaction fingerprint to open Transaction Details.
The transaction fingerprint is displayed as a list of the individual SQL statement fingerprints in the transaction:

The following details are also displayed for the SQL statements in the transaction:
| Parameter | Description |
|---|---|
| Statement | SQL statement fingerprint. To view additional details of a SQL statement fingerprint, click this to open the Statement Details page. |
| Txn Type | Type of transaction (implicit or explicit). Explicit transactions refer to statements that are wrapped by BEGIN and COMMIT statements by the client. Explicit transactions employ transactional pipelining and therefore report latencies that do not account for replication.For statements not in explicit transactions, CockroachDB wraps each statement in individual implicit transactions. |
| Retries | Cumulative number of retries of statements with this fingerprint within the last hour or specified time interval. |
| Execution Count | Cumulative number of executions of statements with this fingerprint within the last hour or specified time interval. The bar indicates the ratio of runtime success (gray) to retries (red) for the SQL statement fingerprint. |
| Rows Affected | Average number of rows returned while executing statements with this fingerprint within the last hour or specified time interval. The gray bar indicates the mean number of rows returned. The blue bar indicates one standard deviation from the mean. |
| Latency | Average service latency of statements with this fingerprint within the last hour or specified time interval. This includes the time taken to execute a query once it is received by the cluster. It does not include the time taken to send the query to the cluster or return the result to the client. The gray bar indicates the mean latency. The blue bar indicates one standard deviation from the mean. |